To understand how well your website ranks in SERP, you need an ideal report. Summarized data with practical recommendations indicate how much work has been done, demonstrate the SEO progress and returns on investment, and provide a monthly plan. It doesn't matter at all whether you work for yourself or are an employee of an agency; a constructive approach to building results and forecasts is simply vital for you.
It's no secret that SEO takes some time to get any results and track progression; you cannot do without setting KPIs. They act as a way of measuring success. Read on to find out which items to examine and instruments to utilize, not waste a lot of time!
Why SEO Report Is Important?
An SEO report is a reasonable way to inform how your diligence has influenced a website’s performance in SERP.
In 2021, the reporting approach has taken on a radically different look: it’s no longer enough to send info about traffic and any related conversions for the last month. Most business owners know how to use Google Analytics and track statistics. On the contrary, you shouldn't make a 200-page monster with completely meaningless metrics. An influential report should express three positions:
Advancement
How far have you progressed in promotion within a certain period? How has the situation evolved since the last account?
Insights
What are your site's vulnerabilities? What areas need improvement?
Recommendations
What advice would you give your customer for further growth?
Since business owners invest money in an SEO strategy, they want to know:
- How prosperous are the KPIs achieved?
- What kinds of work have been done?
- What are the forecasts?
A monthly data slice is necessary directly for the SEO itself: with its help, you’ll recognize plus and cons in tendencies, concentrate on underdeveloped areas, discover new directions and valuable ideas.
What SEO Report Tools You Need?
The trick to powerful planning is displaying the critical to your company parameters. Of course, the software variety that can be utilized in SEO report building is still controversial. We've created a list of versatile tools to begin:
Let's take a glance at the benefits of these programs when tracking crucial metrics.
What to Include in SEO Reports
Building a well-structured report with processed data is significant to establish trust and show the value of the work done to your customers. To save time, build a general template that helps you in future reporting.
1. Title
That is an introduction to your report. It’d contain the project name, date, logo, URL.
TIP: adapt the color scheme of the slides to a branding.
2. Summary
The blurb written in plain language envisages context and transforms your report into an exciting story. You can also incorporate here:
- Tasks completed per month, quarter, year
- The actual state of affairs
- Points to look out for
- Brief description of the traffic situation
- Upcoming goals, meetings, etc.
Goals and KPIs are vital parts of your planning that help effectively track progress and intelligently manage the expectations of all the parties concerned. They’re a backbone and display the ROI of your efforts as SEOs identify problems and trace your strategy’s impact on a business. Let's consider them!
TIP: ensure to compare data with the previous period to see the changes.
3. Traffic
According to Internet Live Stats, Google receives over 74,000 individual queries every second! But how do all these people turn into site visitors? What percentage of your target audience visits a site? Which traffic sources cause the most conversions? How long is the session, and what pages are users frequently browsing? What are your next steps to achieve your objectives? You can answer all these questions by analyzing general traffic statistics. Let's consider the leading KPIs that you should involve in the report.
Use Google Analytics, a great free instrument that indicates all the most critical measures for each traffic channel. First, go through the path: Acquisition → All Traffic → Channels.
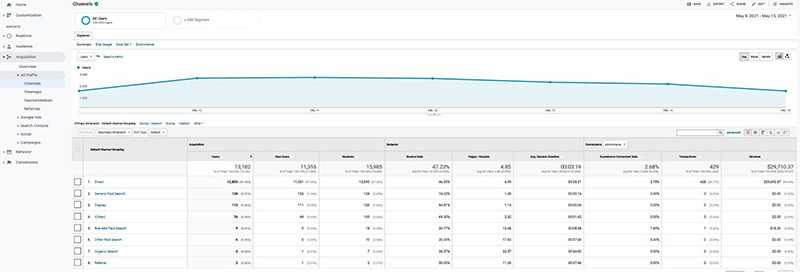
So, we get traffic from 8 sources:
- Organic (from search results)
- Direct (when users purposefully go to your website)
- Referral (through links on outside resources)
- Paid search (via advertisements)
- Social (via social media)
- Email (distribution by emails)
- Display (banners in Google Ads)
- Other (traffic that Google Analytics didn't recognize)
Compare and analyze them to see which one is the most powerful and which can be ignored.
You may also apply SEMrush to separate branded and non-branded traffic. So, the first one is usually determined through the grapevine or recommendations, the second - by users who search for the services and goods described in key queries. Thus, you'll be able to understand which channels are active and how visible you're in SERP.
4. Keyword Ranking
SEO keyword report provides the so-called soft metric for the leading progress indicators. However, it has no direct influence on the brand. E.g., you may display a campaign development in its early phases, when the site isn't yet generating a lot of organic traffic, but its rankings are continuing to grow.
To get a complete list of the key phrases ranking for a certain period, utilize the SERP checker tool.
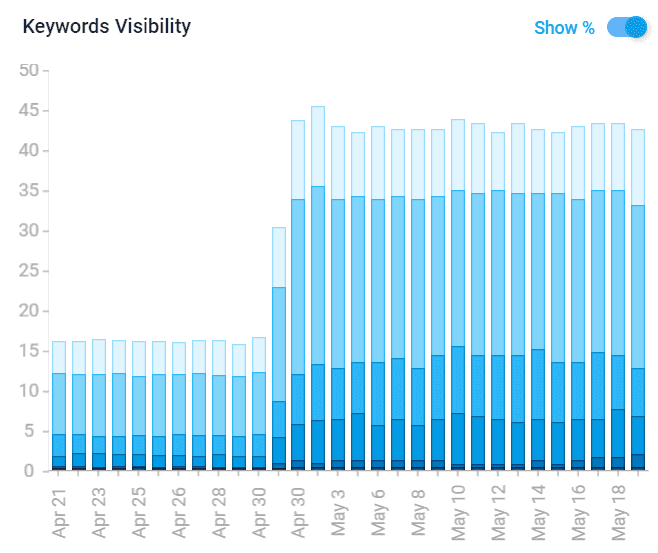
It contains a “Keywords Visibility” graph that displays how many requests are in the TOP 3, 5, 10, etc., as a percentage.
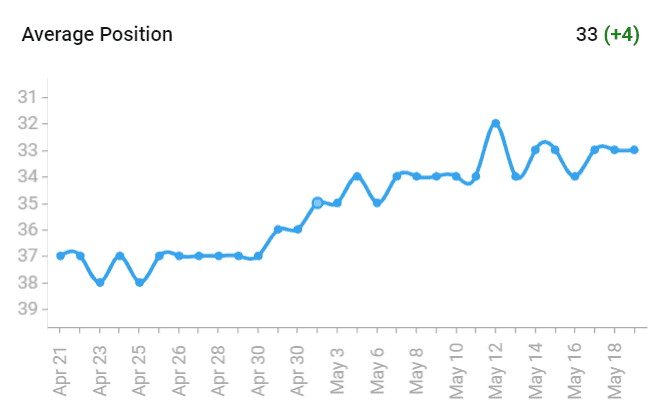
An “Average Position” indicator tells about an average site in search results for tracking keywords. In this example, the curve has high values, which indicates a positive effect.
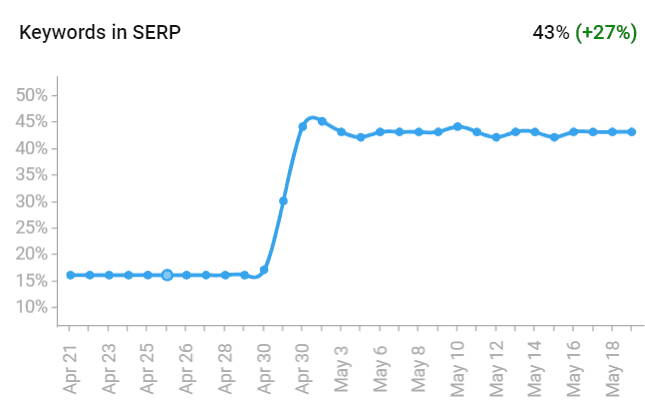
“Keywords in the SERP” graph indicates the terms ranking allocation over a certain period.
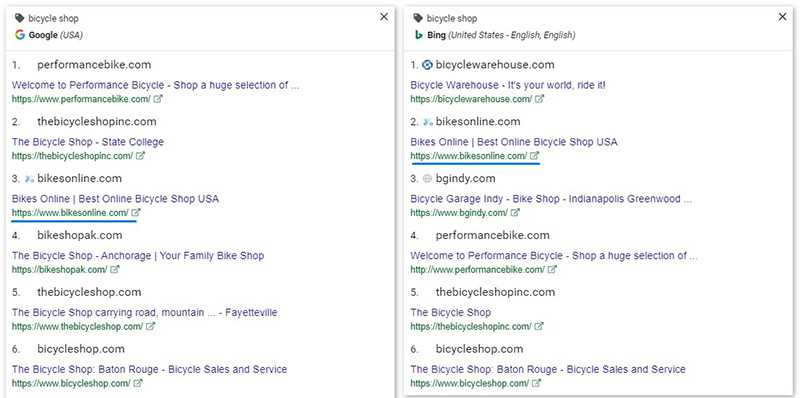
The tool conducts a qualitative analysis of terms for local SEO: this way, depending on the language and geolocation, you can adjust your work accordingly.
Supplement your report with such measures to specify the relevance of queries compared to the previous month.
5. Backlink Ranking
High-quality backlinks are ranking agents, so demonstrating their presence in SEO reports will speak for your work transparency and literacy. For clarity, import the number of generated links for a specific time from Google Sheets with Domain Rating (DR) to Google Data Studio or your report file. There is some correlation (but it's not evidence-based) between a domain's ranking and key phrases. Accordingly, this metric is vital in assessing general growth statistics of referring domains and changes in the words' quantity in SERP. In case of negative practice, analyze the reasons and what types of work should be done to improve performance.
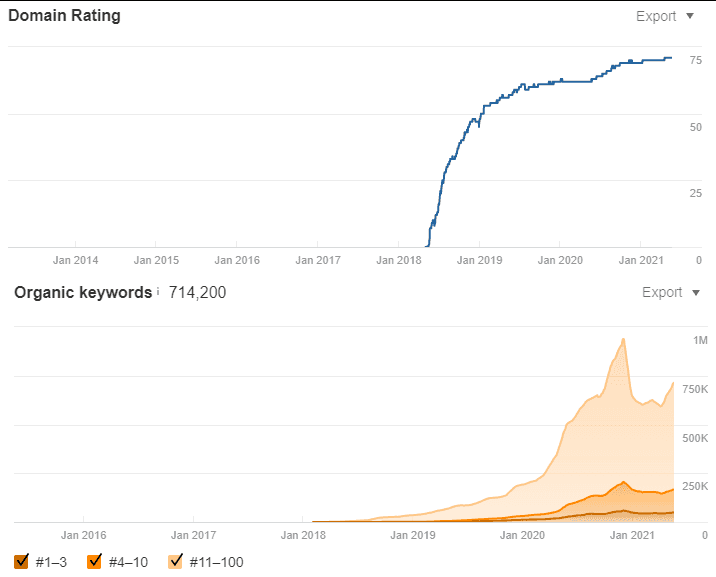
There is no specific range of numbers where your DR can be considered as good. To know how correctly your site is working, compare it to a competitor's website.
In an SEO rank report, you shouldn't concentrate on authority only - demonstrate the general statistics of strong top pages with backlinks. There is a connection between resources referring to a specific page and the organic traffic volume.
Please, pay attention to:
- List of sites where you purchased links
- Analysis of positions for purchased anchors
- General growth statistics of domains and links
- The amount of any lost links
Once you’ve completed reading on this item, devote all your attempts to exploring the Goals and your website's technical side.
6. Goals
Any optimization campaign should start with setting goals in Google Analytics. This way, you can track the user's interaction with the conversion element. It’s crucial not just to make general statistics on conversions but also in the channel context - organic, social, and referral traffic. E.g., you'd check how much organic traffic a page gets and how many leads you have from the total amount of visitors: the higher your conversion rate, the better.
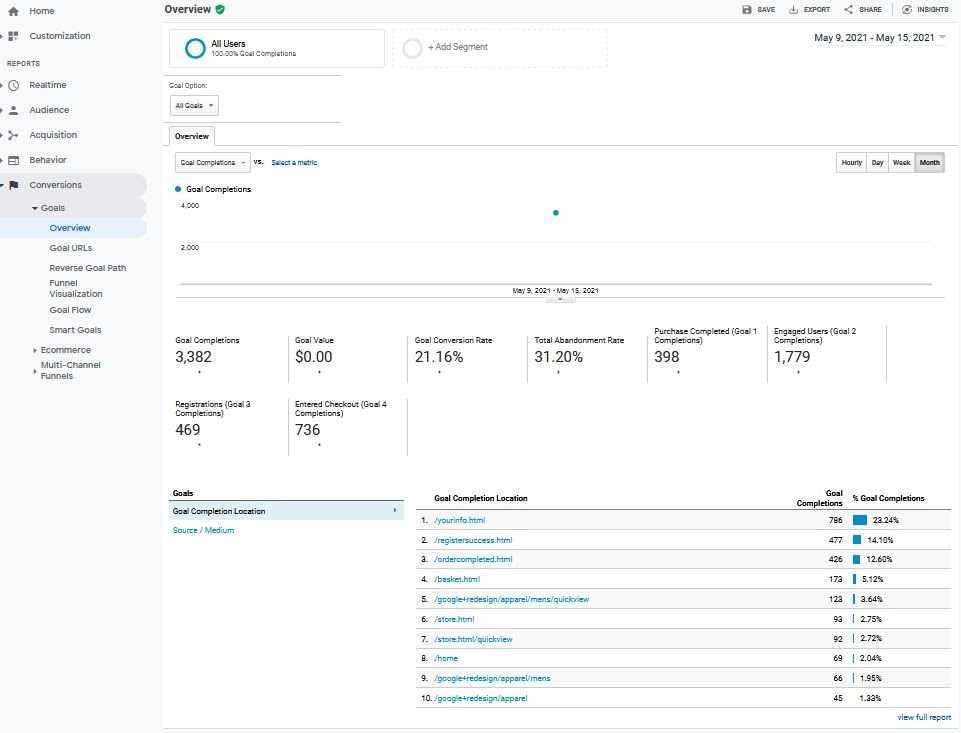
TIP: set up goals ahead of time to be reflected in the report.
7. Technical Report
It includes the technical condition of the site, its errors that influence the visibility in SERP. So, if you conduct a systematic SEO audit, your task is greatly simplified because all you need is to extract the primary data and provide them in screenshots. Of course, it's essential to add comments and explanations to such slides because the business owner doesn't always understand what is at stake.
For a high-quality SEO ranking report, use Screaming Frog or Lighthouse software. They'll help you identify and fix the following errors that you can tell about:
- indexing;
- blocked URLs by robots.txt;
- duplicate content;
- broken links;
- lack of metadata;
- page speed, etc.
You'd analyze why this happened, how these errors affected the implementation of the following 6 and 7 points. Therefore, don't forget to study user interaction with the website.
8. Behavior Analysis
In Google Analytics, go to Behavior → Overview. This report demonstrates the website traffic volume and some additional metrics.
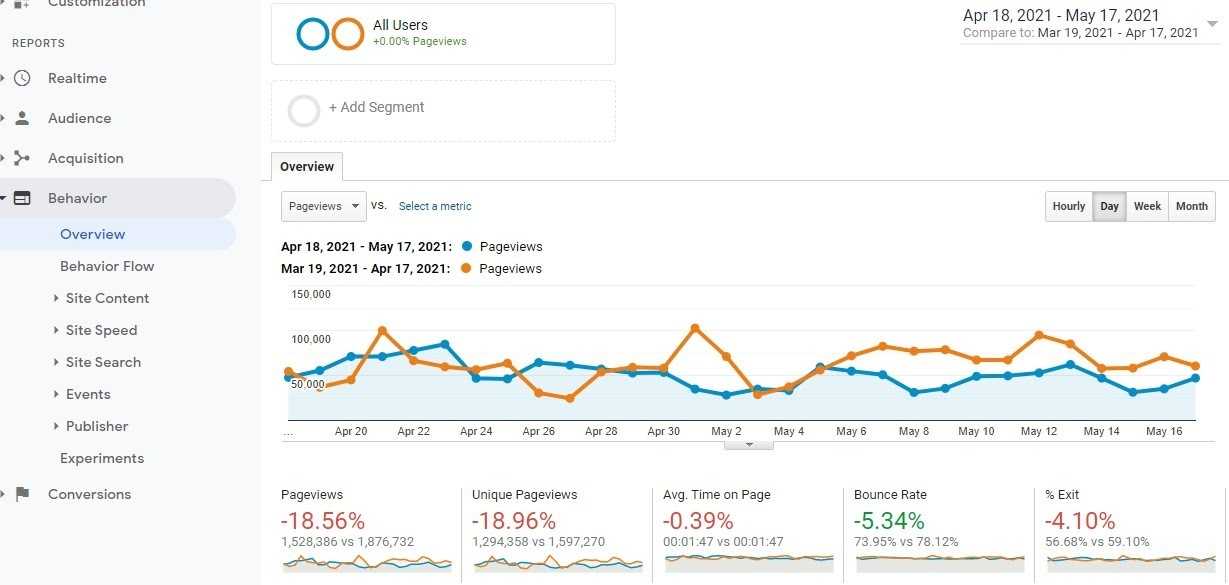
When analyzing this report, explore a Pageviews tab. It indicates an overall number of web pages viewed, including repeat visits. In that case, the red color indicates that the users watched fewer pages compared to the previous period.
Unique Pageviews is the number of pages visited during a session, including each URL + page title combination. If the visitor updates it within a definite period, the GA will register 2 views.
Pages/Session
Tracking site activity is vital. E.g., any actions performed by a visitor indicate an interest in a brand. Go to the Behavior tab → Site Content → Landing Pages. Here you'll see the popular pages. The Pages/Session section (Average Page Depth) indicates the average amount of pages viewed per session.

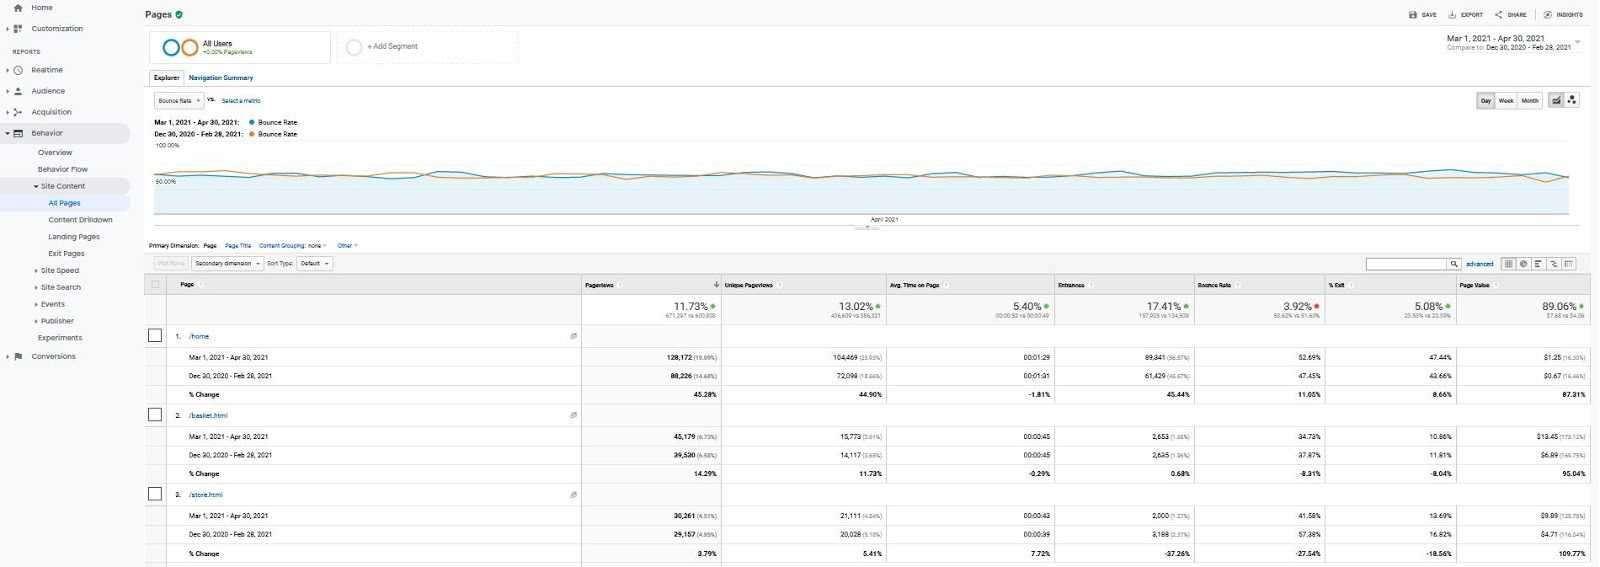
If there is a consistently high bounce rate, mark the subsequent steps in the recommendations:
- Analyze the tracking code implementation
- Consider the design of CTA elements
- Ensure your ad is relevant to the content
Average Session Duration
That is the average time clients spend on the website. Thus, session length might have a positive effect on behavioral factors in Google. A reasonable benchmark for this indicator is 2-3 minutes.
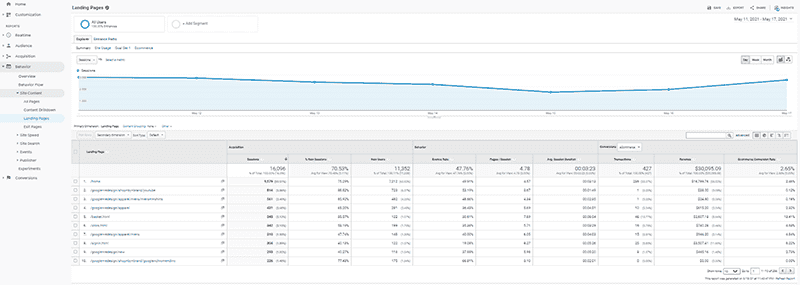
Take note of the Average time on the page displaying how long a user spends on a certain page. In the Exit column, you'll find out on which page a seance ended. Analyze it for the different actions and know how much longer the session duration can be.

TIP: simplify tracing with an SEO report Dashboard.
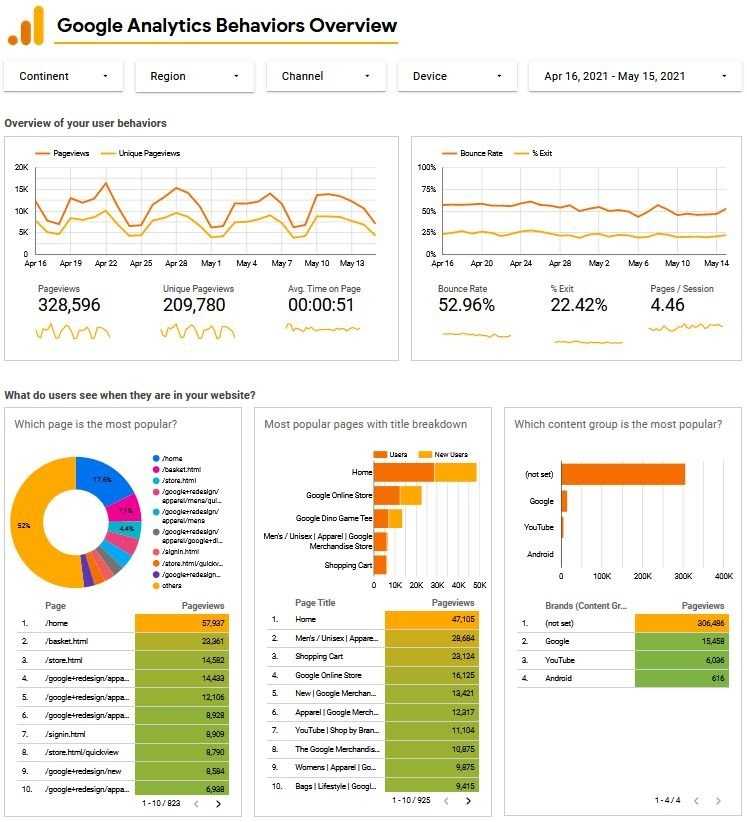
Based on the statistics, you can draw the following conclusions:
- The promotion strategy is successful: 23% of the users return to the resource.
- The only problem with the website is the decrease in the session duration compared to the previous month. Perhaps this is due to ... (and here you must analyze all your actions or inactivity that could provoke this). Outline an action plan to resolve this issue. E.g., add videos and images, analyze the customer journey, test interface usability, update old content, embed internal links, etc.
TOP Landing Page
The metric provides a clear understanding of how searchers discover your site and which pages bring the most traffic. You get the possibility to raise it and determine which pages to optimize purposefully. To get started, go to the Behavior section → Site Content tab → Landing Pages.
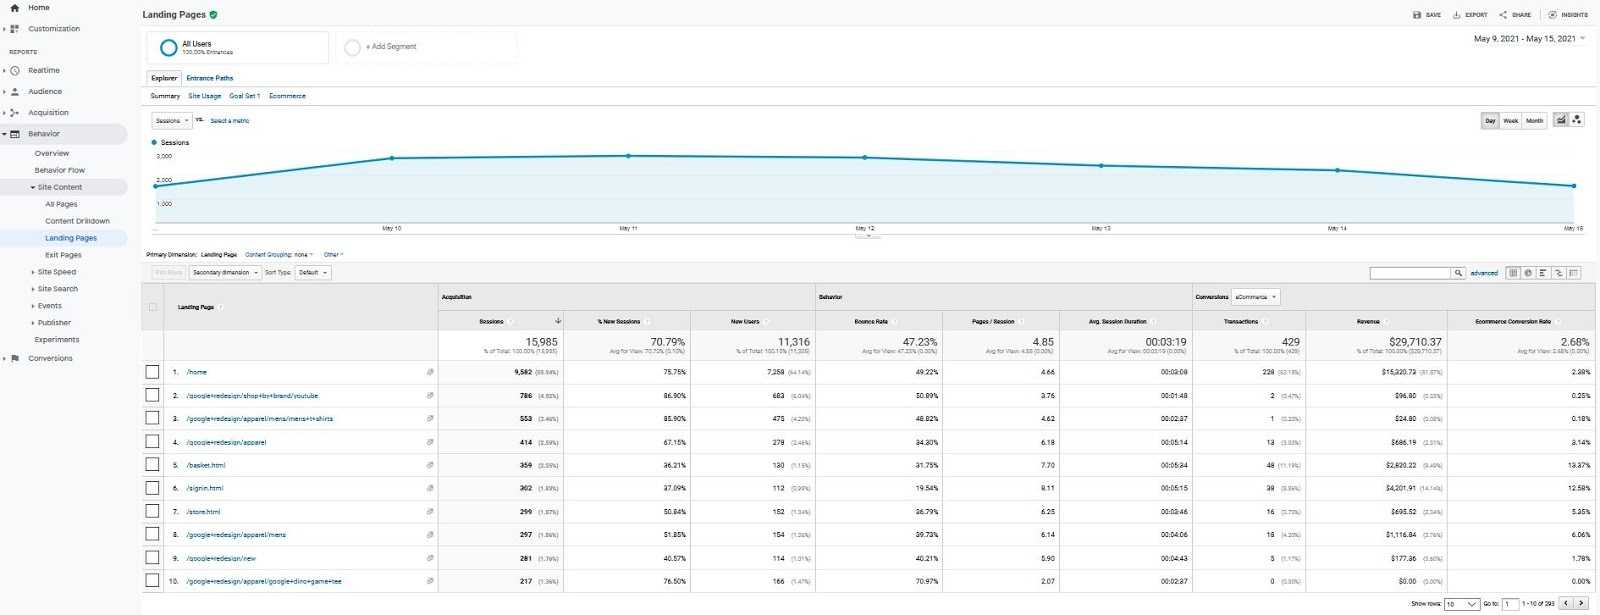
So, what we have:
- Breakdown of data into separate pages
- Graph that displays the total traffic
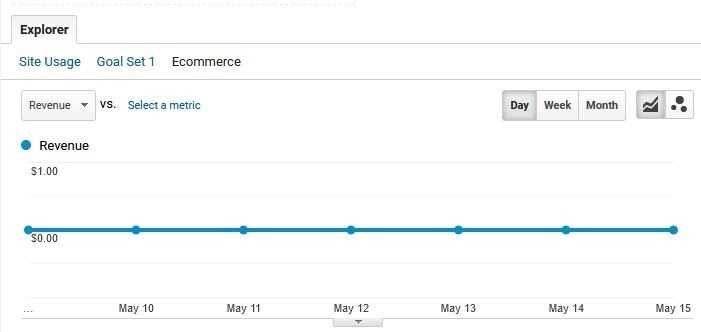
TIP: sometimes, it's worth supplementing your report with additional data. By choosing the E-commerce tab, you can get info on transactions, earnings, and conversion rates. Thus, set objectives before tracing their progressing.
The top 10 positions serve as an introductory part of your website. They make the first impression on the visitor and inspire confidence to varying degrees. Nevertheless, here can be displayed about 5000 URLs of all landing pages!
The key indicators of the report are:
- Sessions (period of active interaction with the site)
Here you can trace tendencies, compare traffic sources and understand which one has the most pages.
- New Users (people who first visited the website for a certain period)
This metric gives you an understanding of how successfully you’ve attracted new users. Don't be discouraged if this measure is low, as users can convert it.
- Bounce Rate (sessions without interaction)
- Conversion Rate and Value
Sites can often have plenty of new clients and low conversion rates. That suggests that it’s necessary to develop the pages. Conversely, raw conversions can be more beneficial depending on the KPI.
If you notice any problems, you can suggest the following optimization solutions:
- Supply users with relevant info about your assortment or services
- Regulate your key phases research strategy to represent changes on your site and in the paid ads.
Site Search
This metric provides insight into whether searchers looked for your site, what terms they’re interested in, and how optimal your scanning is to deliver relevant results.
How often do visitors utilize the search box?
Go to the Behavior → Site Search → Search Terms tab. Here you'll see what they're searching for and the number of sessions with search activity.
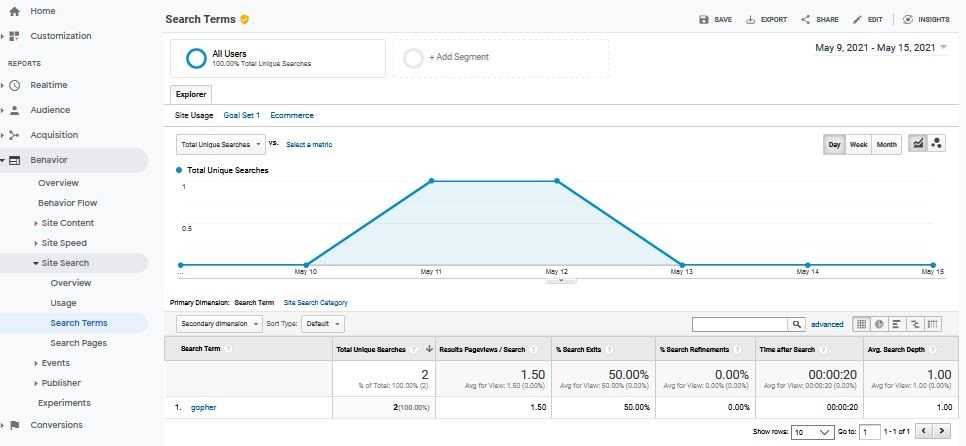

How satisfied are visitors with your search?
The Search Exits indicates when a user left the site after research and didn't go to any other pages. Thus, the higher the % is, the more unhappy the people are. That column is equivalent to the Bounce Rate. It’s hypothesized that the most relevant results help the user arrive at the so-called "golden triangle", and then continue to surf a website.
Please, note Results Pageviews/Search: if its value is greater than 1-2, that means the user has to work really hard to find relevant results.
TIP: use Segment to understand what the audience is looking for.
Does this lead to higher conversions? What are the benefits of the search field?
Utilize the Goal and Ecommerce filters, respectively. If you want to trace visitor income, choose the Revenue filter.
9. Keyword Impressions and CTR
This indicator should be incorporated in the SEO analysis report of any website. It represents the total impressions and their growth over a particular time. Impressions are registered while utilizing the URL that appears in the SERP. Suppose you run a new campaign, and after a month, you gain some impressions. If, after the next month, it also increases, this means that Google is responding positively to your SEO strategy.
Google Search Console is intended for tracking data from real searches. This tool allows us to discover much exciting and diverse info on how your site works in SERP. To enter, click on Performance in the left navigation bar. Let's consider the main indicators, namely, impressions and CTR.
GSC counts impressions every time a page appears in search results. Whether the URL is "below the fold" or a user scrolled down the page, it can get into this number. That applies only to the first page and when a searcher clicks through to the second and further pages.

Otherwise, if the URL appears on the “deeper” pages, impressions won't be counted. CTR indicates how often users click on URLs they see in search results. Calculate it by dividing the clicks per impression.
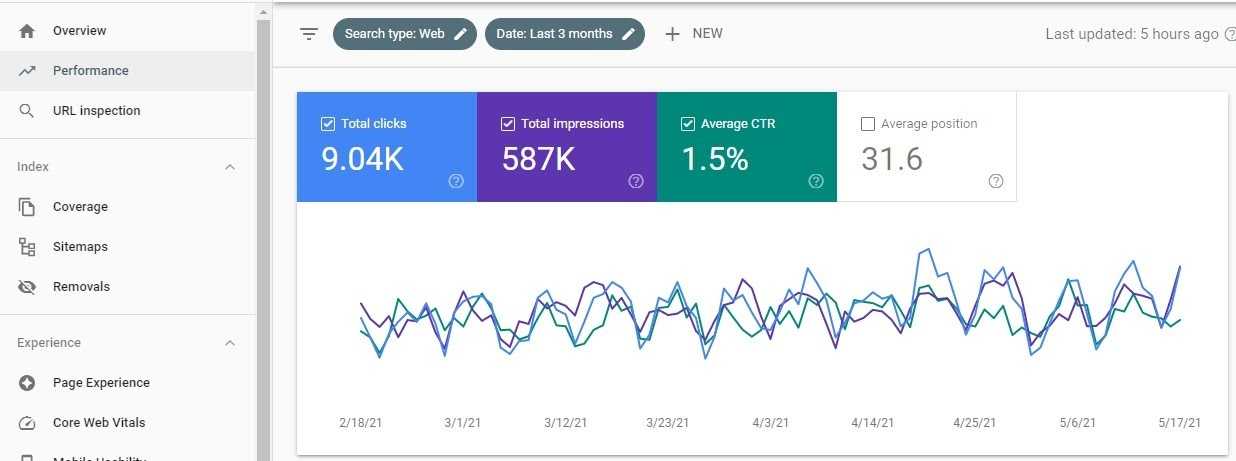
These two indicators are related to the actual query entered into the search box. The top 10 keywords generate the most impressions and represent huge potential for subsequent landing page optimization. By comparing impressions and CTR with the earlier period, you can recognize progression or regression in organic traffic growth. As you’ve reached this point, complete the following three final steps.
10. Tasks Completed This Month
Through the prism of data, graphs, and tables, SEOs efforts aren't always straightforward. With this section, you have a chance to showcase everything you've done this month and how funding was allocated.
Utilize an extract from reports from Google Data Studio.
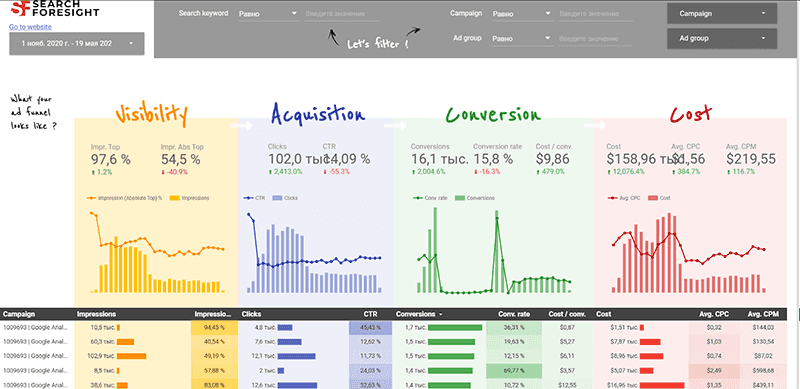
If something went wrong this month, explain why it happened. If everything is great, tell, what contributed to this. You can inform about the progress and pave the way for expectations from the following report.
11. Recommendation
Submit all your recommendations in this section in the form of an evident and precise list.
12. Plan for the Next Month
After completing the SEO report, you must provide your employer with monthly planning and a budget for certain types of work. Provide a to-do list to strengthen collaboration and create specific expectations.
Conclusion
The SEO report is an analysis of the work done and a plan for the near future. It gives a clear understanding of the website's technical condition and its work in search engines. You can also quickly react to any changes by optimizing and modifying your strategy.
For an accurate SEO report, focus on KPIs, which reflect the progress of your work in the most appropriate way. Remember: don’t make long manuscripts with a bunch of numbers and graphs - this is useless, and the client won’t have time to learn them in detail. My advice to you: utilize data from SpySERP, Google Analytics, Google Search Console, Google Data Studio, Ahrefs in combination with Google Data Studio. It'll become a starting point in providing your employers with a concise squeeze of info. You could customize reporting based on needs - play with it, learn a little, and you’ll take your work to the next level.


